 Expert verified
 Knowing the right financial KPIs for business success can help businesses scale smart, cut losses, and stay ahead of competitors.
In this guide, we’ll walk through the essential financial KPI metrics. We also take you through the process of implementing these.
What are Financial KPIs?
Financial KPIs (Key Performance Indicators) are measurable metrics that organizations use to evaluate and monitor their financial health, performance, and efficiency.
These indicators provide measurable insights into critical aspects such as revenue, expenses, profit margins, cash flow, and return on investment.
By tracking these financial KPIs, businesses can make informed decisions, identify trends, set strategic goals, and compare their performance against industry benchmarks or past results.
Importance of Financial KPIs for Business Success
Here are the main reasons why financial KPIs are absolutely critical for any Indian business trying to succeed, grow, and thrive:
Helps You Make Smart Decisions
Financial KPIs provide clear data that guide informed business decisions. They help leaders choose strategies that align with financial health and performance.
Tracks Growth and Profitability
By monitoring KPIs like revenue, profit margins, and ROI, businesses can measure how well they’re growing over time. This insight helps assess the success of operations and long-term strategies.
Keeps Your Finances in Check
Regularly reviewing financial KPIs helps maintain control over spending, earnings, and budgeting. This ensures that the business remains financially stable and avoids unexpected shortfalls.
Helps You Spot Problems Early
Tracking financial indicators can highlight issues like declining sales or rising costs before they become major problems. Early detection allows for timely adjustments to protect business performance.
Avoids Overspending and Waste
Financial KPIs highlight areas of unnecessary expenditure or inefficiencies. This enables better resource allocation and cost-saving measures.
Attracts Investors and Lenders
Good financial KPIs show prospective lenders and investors how stable and profitable a business is. This increases trust and the likelihood of securing funding or credit.
Helps You Set and Measure Goals
KPIs act as benchmarks for setting realistic financial goals and tracking progress. They help ensure that teams stay aligned with the company’s financial objectives.
Keeps You GST & Tax Compliant
Keeping an eye on tax and GST KPIs guarantees that the company complies with its legal requirements. This lowers the possibility of penalties, audits, or legal problems.
Builds Trust With Stakeholders
Transparent financial performance reporting through KPIs strengthens credibility with employees, partners, and customers. This strategic insight helps ensure sustainable growth over time.
Supports Long-Term Growth
By analyzing trends through KPIs, businesses can plan effectively for future expansion. This strategic insight helps ensure sustainable growth over time.
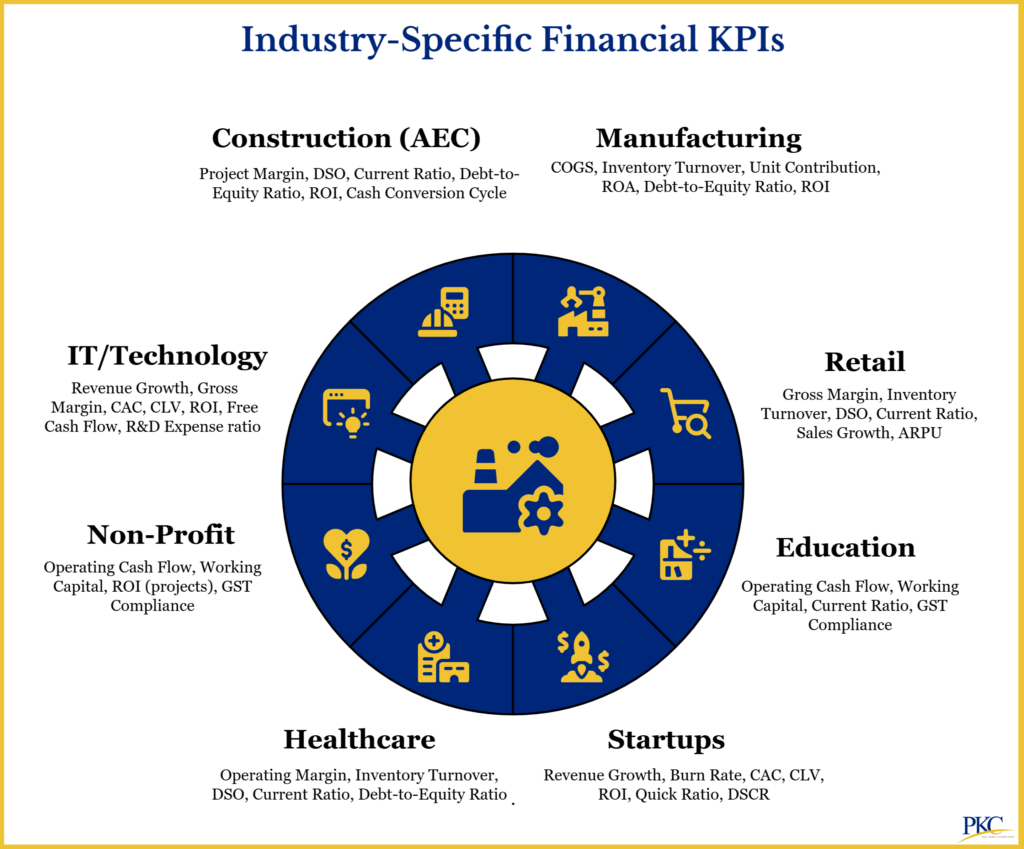
33 Top Financial KPIs Every Indian Business Should Track
Some of the most important financial KPIs for business success are:
Revenue & Profitability Metrics
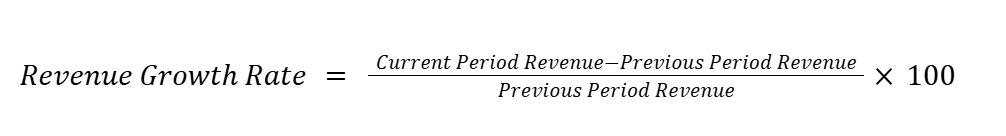
- Revenue Growth Rate
It measures how quickly a business is expanding by comparing current period revenue to previous periods and is a primary indicator of business health.
Formula:
- Gross Profit Margin
After subtracting the cost of goods sold (COGS), it displays the percentage of income that is left over. Better pricing power and operational efficiency are indicated by higher margins.
It demonstrates how well a company converts sales into profit before deducting overhead and other costs.
Formula:

- Net Profit Margin
It displays the percentage of revenue that is converted into actual profit after all expenses, taxes, and interest have been paid.
This is a bottom-line profitability indicator.
Formula:

- EBITDA (Earnings Before Interest, Taxes, Depreciation, and Amortization)
It provides a clearer picture of operational performance by excluding non-cash expenses and financial structure impacts.
Formula:

- Operating Margin (Return on Sales)
Shows the percentage of revenue left after paying for variable costs of production, like wages and raw materials
Formula:

Cash Flow & Liquidity Metrics
- Operating Cash Flow
It keeps track of the actual revenue generated by the business’s core activities.
When evaluating the health of a corporation, it is frequently more accurate than accounting earnings.
It shows if a business can make enough money to stay in business and expand.
Formula:

- Free Cash Flow
Free cash flow represents the cash from operations minus capital expenditures, showing money available for expansion, debt repayment, or dividends.
Formula:

- Working Capital
It stands for the gap between current liabilities and current assets. It measures short-term financial health and operational efficiency.
Formula:

- Current Ratio
It gauges a business’s capacity to settle short-term debts with short-term resources.
Formula:

- Quick Ratio (Acid-Test Ratio)
Similar to the current ratio, it also assesses the ability to meet short-term obligations, but excludes inventory, providing a stricter assessment of liquidity.
Formula:

- Debt Service Coverage Ratio (DSCR)
Assesses a company’s ability to pay its debt obligations with its net operating income.
Formula:

- Return on Capital Employed (ROCE)
Evaluates how well a business makes use of its money to turn a profit.
Formula:

Operational Efficiency Ratios
- Accounts Receivable Turnover
Evaluates the effectiveness of a business’s consumer payment collection efforts. A higher ratio means more effective collections.
Formula:

- Accounts Payable Turnover
Indicates how quickly a company pays its suppliers. A lower percentage could indicate that the business is delaying payments, which could have an impact on supplier relationships.
Formula:

- Inventory Turnover Ratio
It shows the frequency of inventory sales and replacements over time. A higher ratio means efficient inventory management.
Formula:

- Days Sales Outstanding (DSO)
It calculates the average days it takes to collect payment after a sale. It directly impacts cash flow.
Formula:

- Cash Conversion Cycle
The cycles of inventory, receivables, and payables are combined to show how long cash is locked up in operations.
Formula:

Financial Structure & Risk Metrics
- Debt-to-Equity Ratio
Measures financial leverage by comparing total debt to shareholders’ equity, indicating financial risk levels.
It shows the percentage of debt and equity utilized to fund an organization’s assets.
Formula:

- Interest Coverage Ratio
It demonstrates a company’s capacity to cover interest on outstanding debt.
Formula:

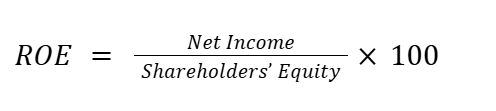
- Return on Equity (ROE)
Measures how effectively a company generates profits from shareholders’ investments.
Formula:
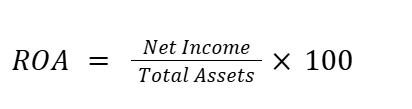
- Return on Assets (ROA)
Evaluates how well a business makes use of its resources to turn a profit.
Formula:
- Return on Investment (ROI)
It evaluates the efficiency of investments by comparing gains to costs.
Formula:

Customer & Market Metrics
- Customer Acquisition Cost (CAC)
Calculates the average cost of bringing on each new customer while accounting for marketing and sales expenses.
Formula:

- Customer Lifetime Value (CLV)
Estimates the total revenue a business can expect from a single customer over their relationship, helping optimize acquisition spending.
Formula:

- Average Revenue Per User (ARPU)
It measures revenue generated per customer, useful for subscription and service businesses.
Formula:

Cost Management Metrics
- Operating Expense (OPEX)
It tracks ongoing operational costs for running a business, such as rent, utilities, and salaries as a percentage of revenue. It indicates cost control effectiveness.
Formula:

- Cost of Goods Sold (COGS) Percentage
Demonstrates how direct production expenses affect gross margins in relation to revenue.
Formula:

- Gross Burn Rate
It measures monthly cash consumption. A very useful financial KPI for startups and growth-stage companies.
Formula:

- Capital Expenditure as Percentage of Revenue
Indicates the proportion of revenue spent on capital investments, essentially tracking investment in long-term assets relative to business size.
Formula:

India-Specific Compliance Metrics
- GST Compliance Rate
It assesses compliance with Goods and Services Tax laws, which is essential for avoiding fines and preserving good standing.
- Tax Efficiency Ratio
Evaluates how effectively a business handles its tax liabilities in relation to its revenue.
- Tax-to-Revenue Ratio
It is a measure of tax efficiency that shows the percentage of revenue paid in taxes. It guarantees adherence to Indian tax laws and maximizes tax planning.
Valuation Metrics
- Price-to-Earnings (P/E) Ratio
Compares market price per share to earnings per share to determine market valuation in relation to profitability.
Formula:

- Earnings Per Share (EPS)
It divides net income by outstanding shares, showing profit generated per share for publicly traded companies.
Formula:

How PKC Can Help?
✅Benchmarking expertise identifies relevant financial KPIs
✅Experts deliver scalable financial consulting solutions
✅Financial dashboard consolidation enables strategic KPI monitoring
✅ROI tracking enables investment decision optimization
✅Real-time monitoring through integrated reporting platforms
✅Executive KPI scorecards streamline board reporting processes
✅Cross-functional KPI alignment connects operations with finance
How to Track Financial KPIs for Business Excellence?
This is a straightforward guide to help you monitor financial KPIs for your company:
1. Align KPIs with Business Goals
Define what you want to achieve—growth, profitability, cash flow, or expansion—and choose 8–12 KPIs that match your stage and industry.
2. Collect Accurate Data
To automate data collection and guarantee quality through frequent checks and reconciliation, integrate systems such as Tally, QuickBooks, or Zoho.
3. Use the Right Tools
Pick tools based on your needs: Power BI/Tableau for depth, Google Data Studio for budget-friendliness, or Zoho Analytics for simplicity. Ensure they support Indian accounting standards and GST compliance.
4. Build Actionable Dashboards
Design dashboards for quick insights using color codes and historical comparisons. Include drill-downs and mobile access.
5. Set Reporting Frequencies
Track KPIs daily (cash flow), weekly (inventory), monthly (margins), and quarterly (ROI). Automate report delivery with clear summaries.
6. Start Simple, Scale Smart
Begin with core KPIs, create benchmarks, and assign responsibility. Expand as the system matures.
7. India- Specific Business Needs
Support GST, multi-currency handling, and local compliance (e.g., labor laws, environmental costs).
8. Analyze and Improve
Use alerts for out-of-range metrics, track trends, and compare with industry benchmarks. Review KPIs monthly and annually for relevance.
9. Avoid Common Errors
Break data silos, automate manual processes, and ensure team buy-in with training.
10. Keep Evolving
Get input, improve dashboards, and keep improving tracking to make smarter choices.
Frequently Asked Questions
1. What are financial KPIs, and why are they important for businesses?
Financial KPIs are measurable metrics that show how well a company is performing financially. They assist you in making wise choices, preventing losses, and expanding sustainably in the rapidly evolving business world of today.
2. Which financial KPIs should every small business in India track?
Key ones include revenue growth, net profit margin, current ratio, and cash flow. These help monitor your income, expenses, and ability to pay bills on time.
3. What tools can help Indian businesses track financial KPIs?
Tally, Zoho Books, Marg ERP, and Google Sheets are great options. They’re affordable and suitable for both startups and traditional Indian businesses.
4. Are financial KPIs different for startups and established companies?
Yes, startups often focus on CAC, CLV, and burn rate, while mature businesses track ROI, debt ratios, and efficiency metrics. Each stage needs different KPIs to grow.
5. How often should businesses review their financial KPIs?
Businesses should, at a minimum, review the financial KPIs monthly. Fast-growing startups and SMEs may benefit from weekly reviews.